
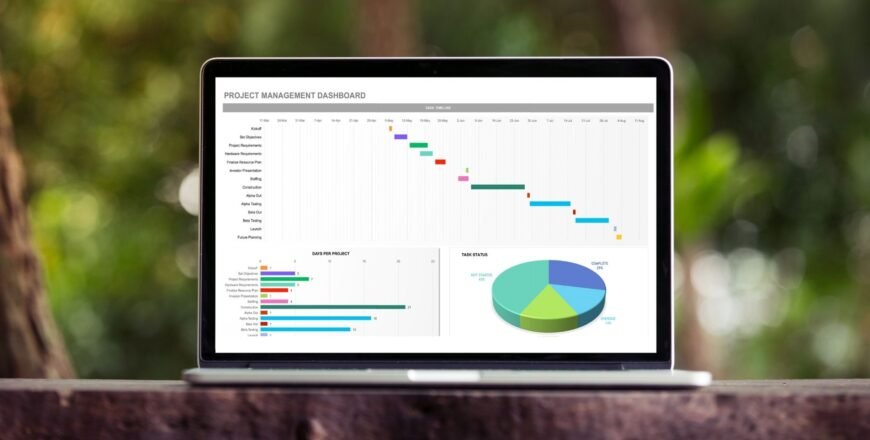

Excel Pivot Tables, Pivot Charts, Slicers, and Timelines on Course Plus is a comprehensive Microsoft Excel course designed to help learners transform raw data into meaningful insights through powerful data analysis and reporting tools. This course provides step-by-step instruction on creating Pivot Tables, building interactive Pivot Charts, and using Slicers and Timelines to filter and visualize data efficiently. Whether you’re working with business reports, sales figures, financial data, or operational metrics, you’ll learn practical techniques to analyze large datasets quickly and accurately.
Ideal for professionals, students, analysts, and business owners, this Course Plus program goes beyond the basics by introducing advanced Excel features such as PowerQuery, PowerPivot, calculated fields, and dynamic dashboards. Through hands-on exercises and real-world examples, you’ll develop the skills needed to automate reporting, identify trends, and present data in a clear and impactful way. With flexible self-paced learning and lifetime access to course materials, this course empowers you to make smarter, data-driven decisions and enhance your productivity with Excel.
-
6
 Formatting the Pivot Table
 -
7
Sorting and Filtering the Pivot Table
-
8
Creating a Dashboard with Slicers, Timelines and Pivot Charts
-
9
Reporting by Day, Month, Quarter, or Year within the Pivot Table
-
10
Refreshing the Pivot Data with New Data
-
11
Adding Your Own Calculations into the Pivot Table
-
12
The Power of the Filter Section in the Pivot Table